
Power BI Dashboard Development
Convert your cluttered data into stunning, insightful Power BI dashboards that tell your unique business story. Get Trusted partners, Strategic Solutions, and Enhanced dashboards All in one.
Book your free consultation today!


Get A BI Tool that is Beyond Average for Your Business
Power BI Dashboards are the most sought-after way to track your business with quick reports and key metrics at a glance. They combine data from various sources into clear charts and graphs, providing a simple overview of operations.
Our Power BI dashboard experts manage every step from the initial setup and seamless data integration to advanced customization with minimal upfront cost helping your business stay ahead of the competition. Consult our Microsoft-certified Power BI experts to streamline your data compilation and unlock the full potential of your information.
Power BI Services We offer
Power BI Dashboard Consultation
When the dashboards are easy to navigate and actionable, it makes the work half done. We guide you in building easy-to-use dashboards that highlight the most important data. Our focus is on simple, clear visuals that help you quickly understand trends and make informed choices.
Custom Dashboard Design & Development
Business-specific dashboards simplify complex business data into clear, actionable information. We design dashboards tailored to your business needs. Whether you use SQL, Excel, or SharePoint, we ensure smooth data integration so you can access real-time insights anytime, anywhere.
Data Organization & Transformation
Organized data helps businesses make intelligent and strategic decisions driving ROI. We clean, structure, and organize your data so it flows efficiently into Power BI. Our team also creates custom formulas to help you track key business metrics and spot important patterns.
Power BI dashboard Optimization
Responsive dashboards deliver clear business insights without overwhelming the users. We fine-tune your Power BI setup to ensure fast loading times, even with large datasets. We also simplify complex visuals so your reports are clear, easy to use, and insightful.

Our Best Practices for Advanced Power BI Dashboards
| Features | Our Best practices |
|---|---|
| Choosing the Right Visuals | We pick the best chart type for your data. Use line charts for trends, bar charts for comparisons, pie charts for parts, and maps for location data. |
| Custom Visuals | We add extra charts like heat maps, radar charts, bullet charts, and KPI gauges to help make your data clearer. |
| Conditional Formatting | We use colors, data bars, and icons to make trends, limits, and unusual values stand out so you can understand your data quickly. |
| Dynamic Visuals | We include interactive filters and slicers so you can explore your data from different angles. |
| KPI Indicators | We show key numbers with visuals that compare targets to actual results, making performance easy to assess. |
| Hierarchical Layouts | We set up drill-downs and tree maps so you can explore data at different levels, from the overview down to the details. |
| Tabbed Dashboards | We organize dashboards into tabs, letting you focus on one area of data at a time. |
| Storytelling Flow | We design dashboards that take you from a big-picture view to detailed insights, guiding you through the data step by step. |
| Consistent Branding | We use your brand's colors and style throughout the dashboard to make important data stand out and keep the look familiar. |
| Minimalist Design | We keep the layout clean and simple, using plenty of white space so that only the most important visuals catch your eye. |
| Alignment & Grid Systems | We arrange everything in a neat grid so that all elements line up well and are easy to read. |
| Responsive Layouts | Our dashboards adjust automatically to fit any screen size, whether you're on a computer, tablet, or phone. |
| Mobile-Friendly Design | We ensure your dashboard stays clear and interactive on mobile devices, so you can access your data anywhere without any hassle. |
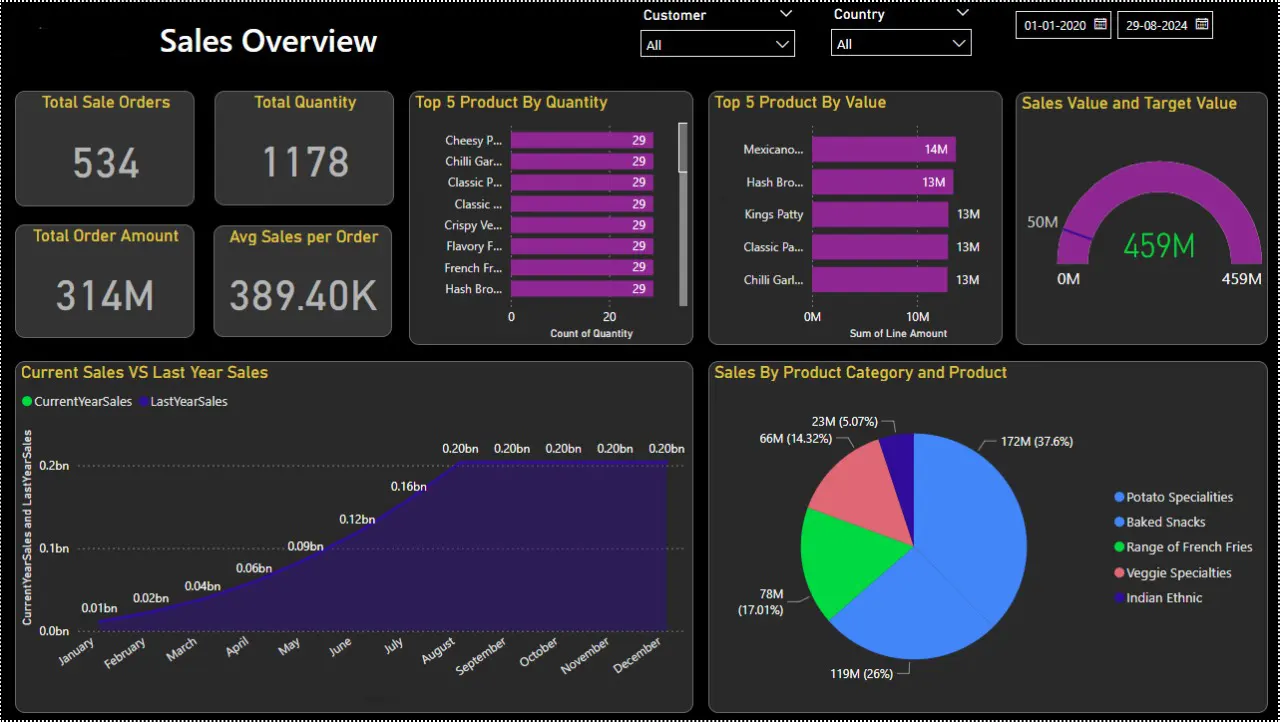
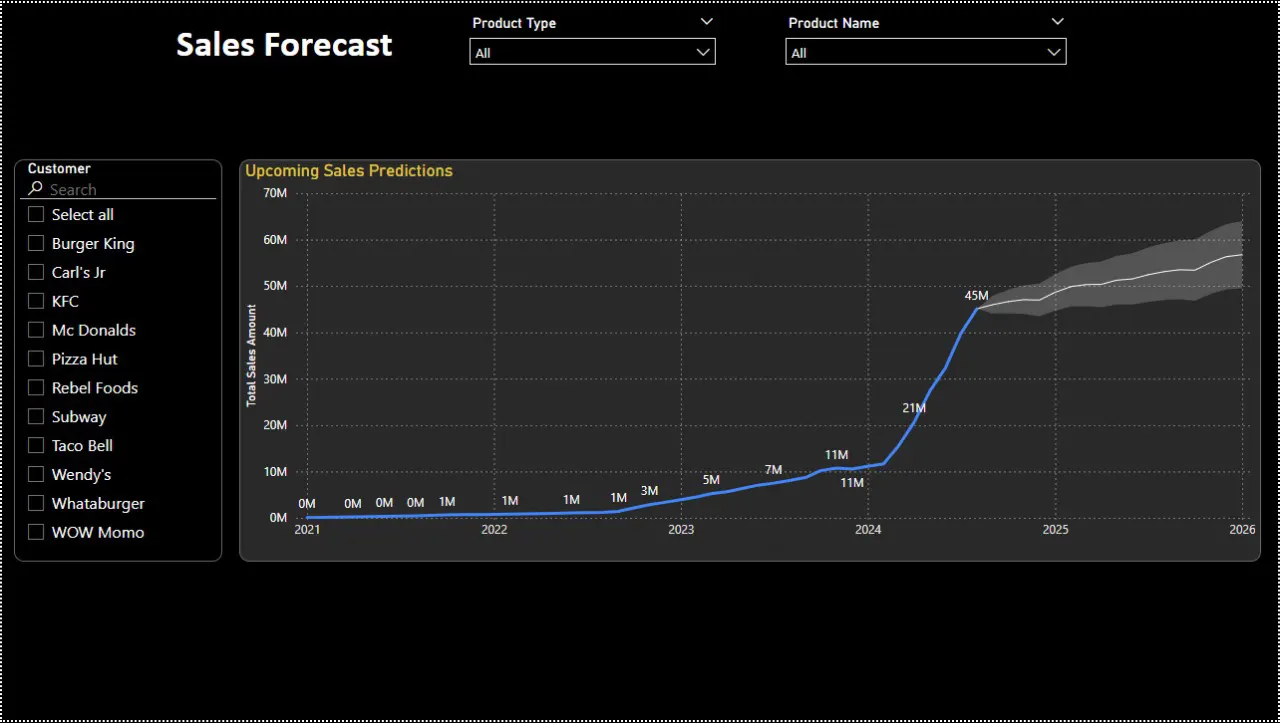
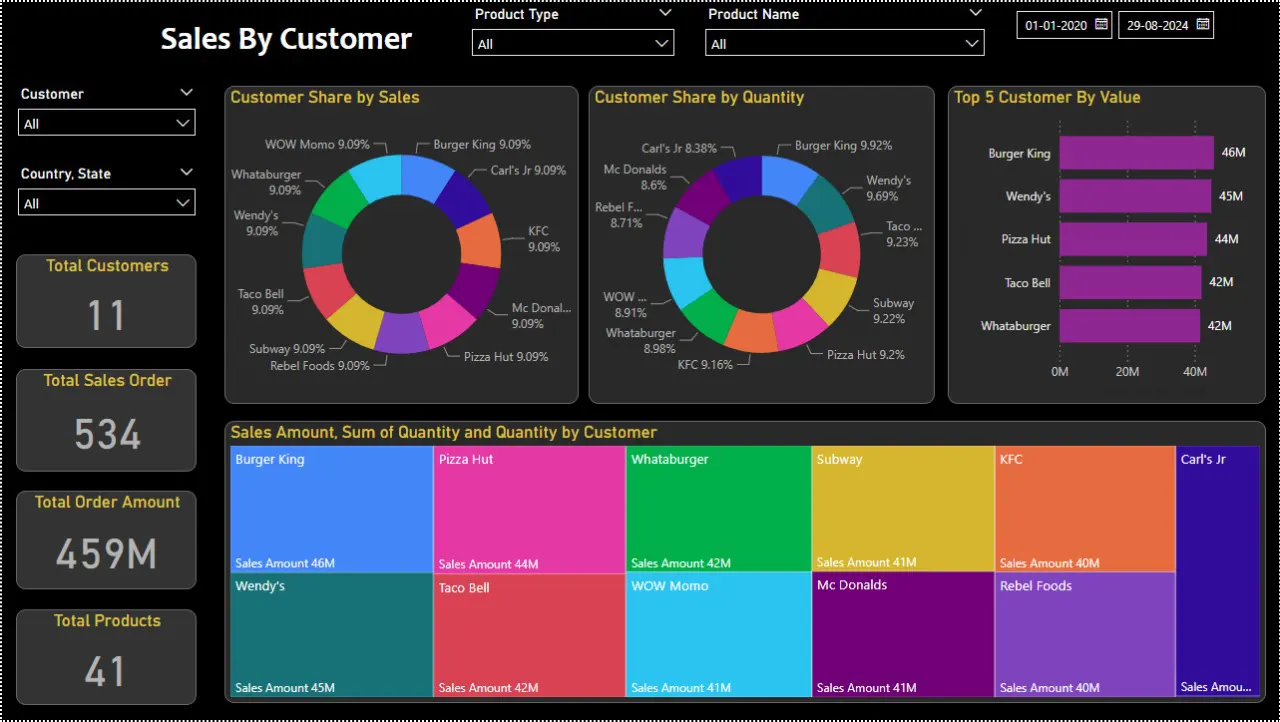
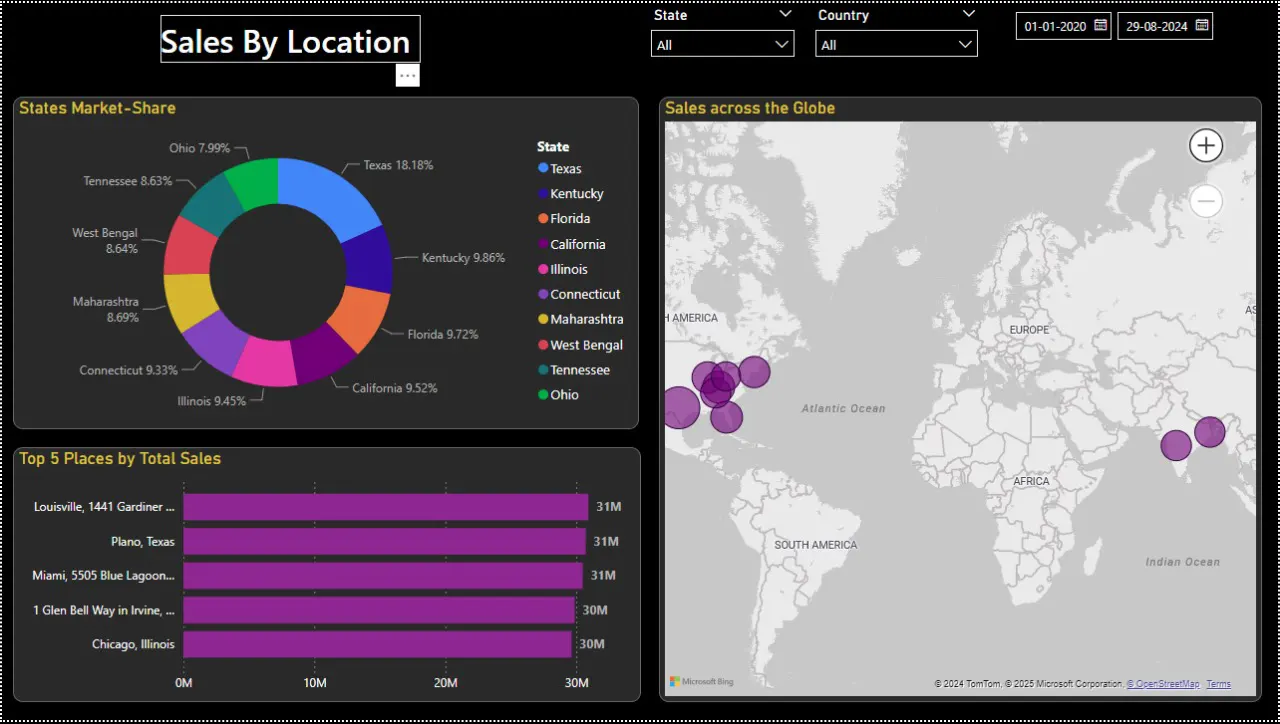
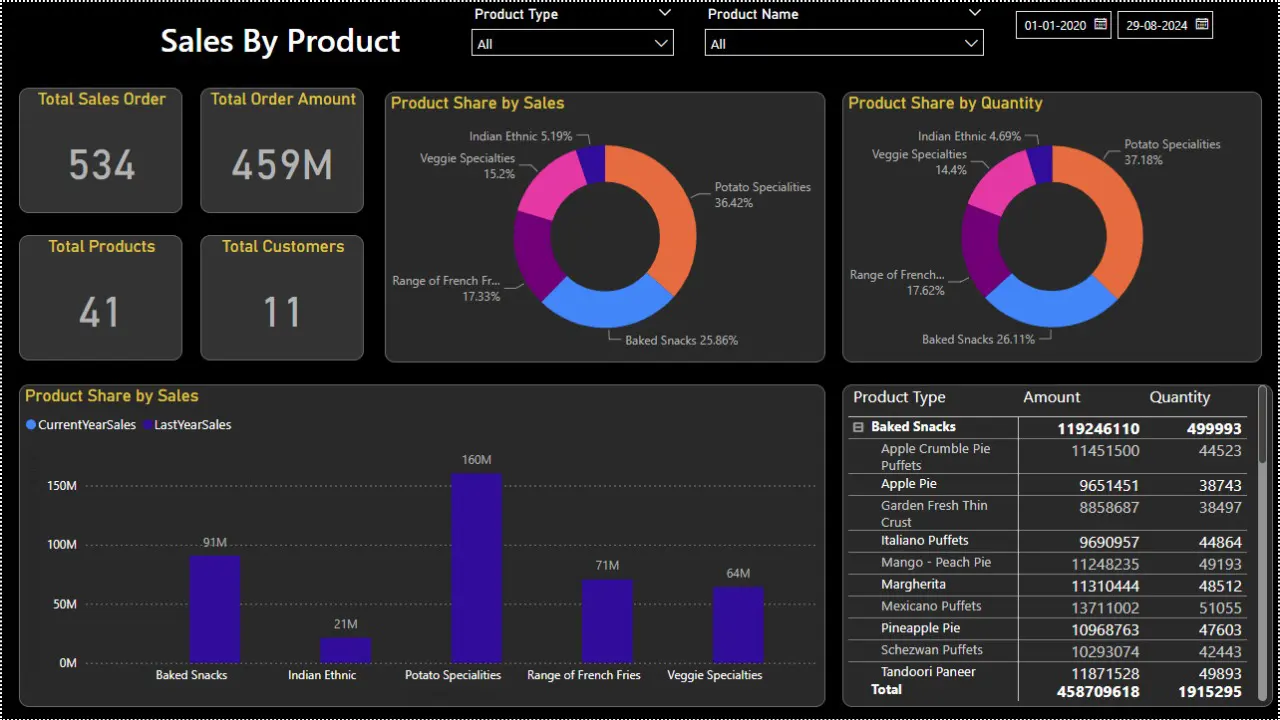
Explore Our Power BI Dashboard Development works
- Power BI dashboards turn complex data into a simple, interactive view.
- All your KPI numbers are displayed on one clear screen.
- You can click on the tiles of the dashboard to see more detailed reports.
- Power BI dashboard offers multiple charts, graphs, maps, and custom visuals to best display your data.
- You can change the theme, layout, and interactive features to match your needs.
- The dashboard updates in real time, keeping your information current.
- It quickly shows what’s working and what isn’t, helping you make fast decisions.
- You can check your statistics anytime, on any device.
- Ask questions in plain language and get answers quickly.
- It uses your data to help predict future trends and support smart decision-making.
- It seamlessly integrates with Microsoft 365 and other tools, making collaboration smoother.
Client Testimonials

When we were struggling with disjointed data and lacked meaningful insights, Aegis stepped in. Their team not only helped us integrate Power BI seamlessly into our existing processes but also customized dashboards. The dashboards are intuitive, and now we make decisions quickly and are more informed.
We partnered with Aegis as we needed a reporting solution that is efficient and easy to use. Aegis developed Power BI dashboards that not only consolidated data from multiple sources but also reduced our reporting time by 40%. We are no more being bogged down by manual reports. I Highly recommend this professional team!
Aegis delivered a Power BI dashboard that brought everything related to key metrics into focus. We can now track sales performance, customer interactions, and pipeline health at one glance at the dashboards and act faster and smarter. Their team also provided training that made adoption seamless.
Aegis implemented Power BI dashboards in our financial institution that allowed us to access detailed information quickly. We now feel confident that our data is secure and still provides the visibility we need. The team is highly professional, they understand the pulse of the business and give the solutions.
Why Choose Aegis for Power BI Dashboard Development?
Experience
We have 19+ years of hands-on experience delivering Power BI dashboards worldwide. With 40K+ installations and support for 30K+ users in various time zones, we currently provide custom solutions to many Fortune 500 companies with affordable, on-time deliveries.
Microsoft Certified Experts
As a trusted Microsoft partner and global leader in Microsoft products, we support your project end-to-end. Our team consists of 50+ of India’s top 3% Microsoft-certified developers. Call us today for a Power BI dashboard consultation with our experts.
Development
We work in agile sprints, hold daily standups, and share regular updates to keep you updated. And informed. We collect data from all your sources and use Power BI’s robust tools to build dashboards tailored to your industry, providing immediate and practical insights for your business.
Support
We provide complete support through thorough quality checks, regular testing, and ongoing maintenance to ensure smooth operations without any last-minute issues. We offer quality, clear communication, fair pricing, and full confidentiality under an NDA.

Our Capabilities in Power BI Dashboards
We build Power BI dashboards that do more than just display data—they help your business grow by turning data into clear and useful insights.
Create Interactive Dashboards
We create user-friendly and dynamic dashboards with many advanced features that make it easy to explore and understand your data.
Efficient Data Transformation
We clean and organize your raw data using Power Query and use automation and custom scripts to manage large datasets efficiently.
Quick Report Generation
Our team fine-tunes DAX formulas, reduces dataset sizes, and uses advanced techniques to speed up report generation.
SQL Integration
We connect Power BI with SQL databases such as Azure, Oracle, and MySQL for smooth data extraction and reporting.
Embed Reports
We embed Power BI reports into apps, web portals, and SharePoint easily, so you can access it from anywhere.
Handle Security and Compliance
We secure your data with Row-Level Security and strict access controls, ensuring reports meet compliance standards.
Seamless Data Integration
We bring data from APIs, Excel, and cloud platforms for unified, real-time reporting.
Data Model Optimization
We design strong data models for faster and more reliable reports.
FAQs
Our Power BI dashboard development services in India start at $25 per hour and it may vary based you’re your project complexity and business specifics.
Yes, with a free Power BI license, our consultants help you access reports, apps, scorecards, dashboards, and more.
A simple dashboard and report can be ready in 3 to 14 days. More complex dashboards with multiple data sources will take a bit longer.
| Purpose | Provides a high-level, real-time view of key metrics. | Designed for in-depth data analysis and exploration. |
| Interactivity | Non-interactive, meant for quick monitoring. | Highly interactive, allowing users to drill down and explore data. |
| Pages | Single-page view. | Multi-page, offering detailed analysis. |
| Data Sources | Can combine visuals from multiple reports and datasets. | Uses data from a single dataset. |
| Ideal For | Executive summaries, real-time monitoring, and quick insights. | Detailed data exploration, trend analysis, and decision-making. |
| Example | A dashboard displaying KPIs like revenue, sales, and customer acquisition cost. | A sales report analyzing performance by region, product, and period. |
We offer the following Power BI dashboards,
- Interactive Report Dashboards,
- Analytical Dashboards,
- Strategic Dashboards,
- Financial Dashboards And
- Marketing Dashboards.
Empowering data-driven decisions requires getting meaningful analytics views to many cross-functional teams for impact. But how do you maintain prudent restrictions preventing sensitive data overexposure? Passport to resolution lies with thoughtfully structuring Azure Active Directory administrative roles and access levels.
As data volumes and complexity grow, Power BI dataflow processing can hit snags that delay refreshing datasets and reports. With dependencies on Azure Data Factory behind the scenes, what tuning steps can help shorten lagging pipeline run times? This 5-step guide highlights optimizations for performant data flow ETL logic and Azure resource allocations accelerating Power BI dataset availability.