Troubleshooting in ServiceNow: the xmlStats.do Command Tutorial
In ServiceNow, the `xmlStats.do` command is a powerful diagnostic tool used to monitor system performance. The command “https://instance.com/xmlastats.do” provides detailed XML output containing important statistics about the system’s health, including memory details, active sessions, node performance, and database activity. For those using ServiceNow Managed Services, this command is useful for maintaining optimal performance and ensuring that your managed environment runs smoothly.
This information is crucial for administrators to identify systems performance, and ensure the instance runs smoothly. This command can be essential for effective system monitoring and troubleshooting in ServiceNow Development.
Post San Diego release, the System Diagnostics homepage is deprecated which provides systems performance metrics. By default, new instances post San Diego version do not have a System Diagnostics homepage. It was a truly a best tool to understand the instance health and optimize the instance performance. However, the `xmlStats.do` command can be a valuable alternative.
Overview of various components of xmlStats.do and how to interpret them
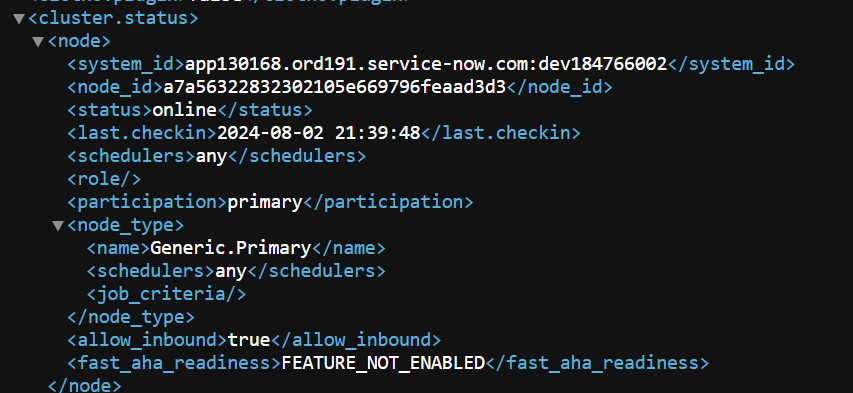
Node Details:
This section gives clear picture of nodes available, and their status.
In addition, it also gives if they are available for AHA readiness (Advanced High Availability Readiness)
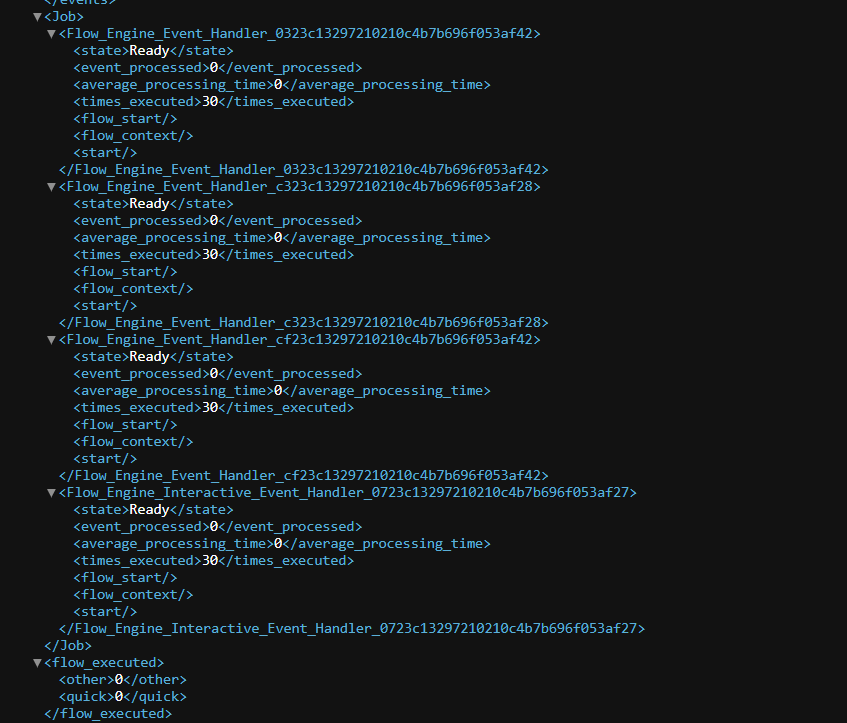
Flow Details:
This section shows information about executed flows and details about the Flow Engine Event Handler. This helps to troubleshoot issues related to flow execution, such as flows that are not running or are stuck.
Semaphore details:
Semaphores define number of transactions that a node can execute. This can be analysed to understand node health with respect to transactions.

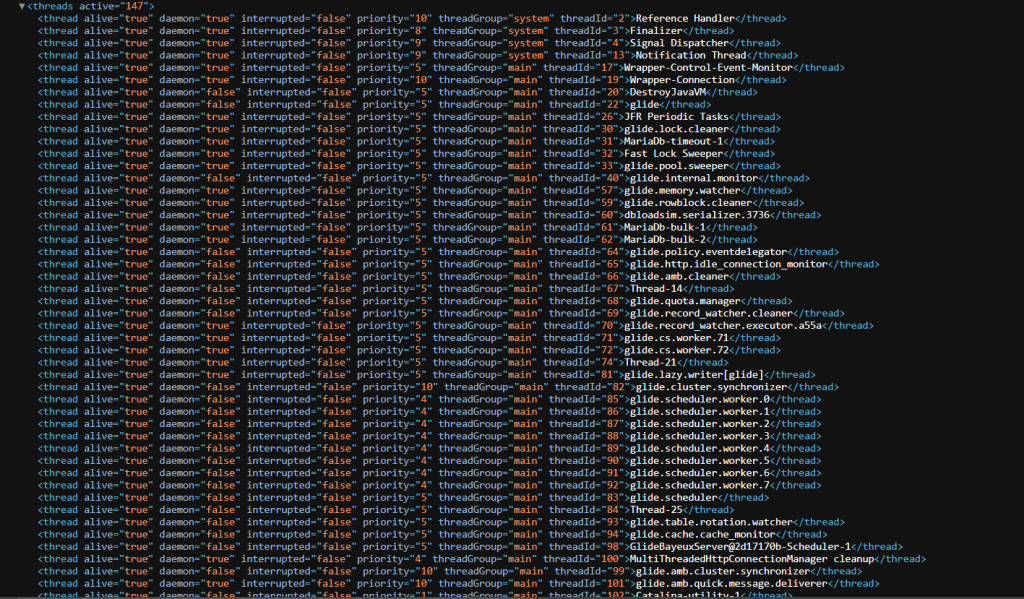
Thread details:
Threads are similar to semaphores. Worker threads are responsible for executing schedule jobs.
The Thread metrics can be analysed to understand the long running schedule jobs in the instance.
Pending schedule jobs and update sets installed in last 24 hours:
This section provides information about pending scheduled jobs and updates installed in the last 24 hours. It helps in troubleshooting long-running jobs and identifying recent updates that might be affecting system performance.

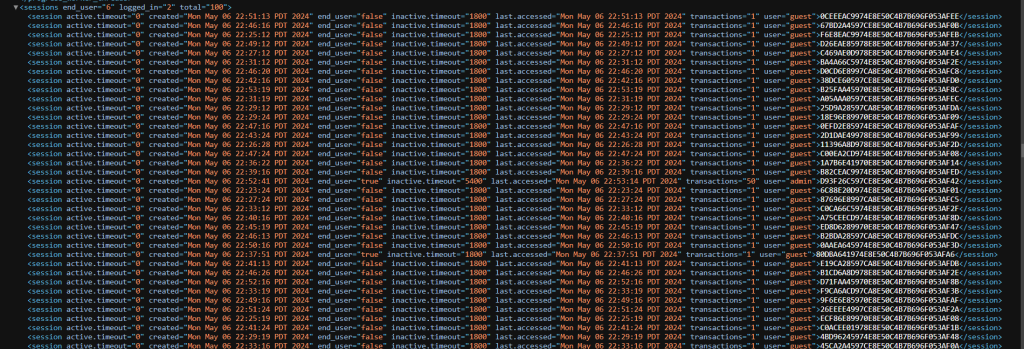
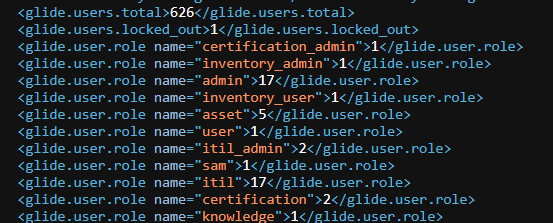
Current logged in users details
This section shows the number of users currently logged in per node, as well as a role-wise user count. This helps administrators understand node performance concerning user transactions.
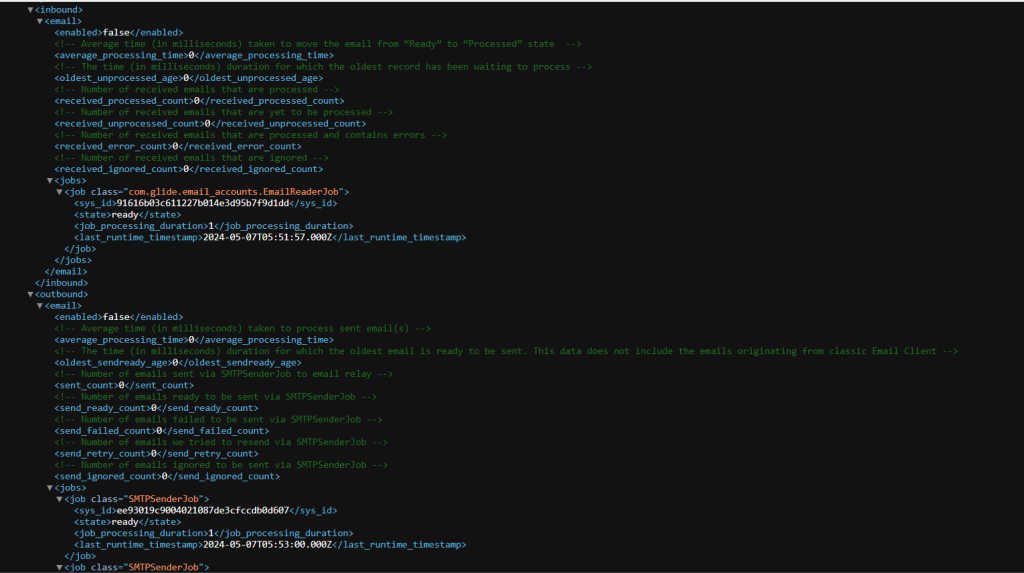
Inbound and outbound emails metrics:
Inbound and outbound emails processing in crucial for any instance. Particularly if the instance is production instance, it is important the instance processes inbound emails for various inbound actions and outbound emails for the various communications.
The metrics give processed count, time and related jobs. this helps to understand systems performance in terms of sending and receiving emails
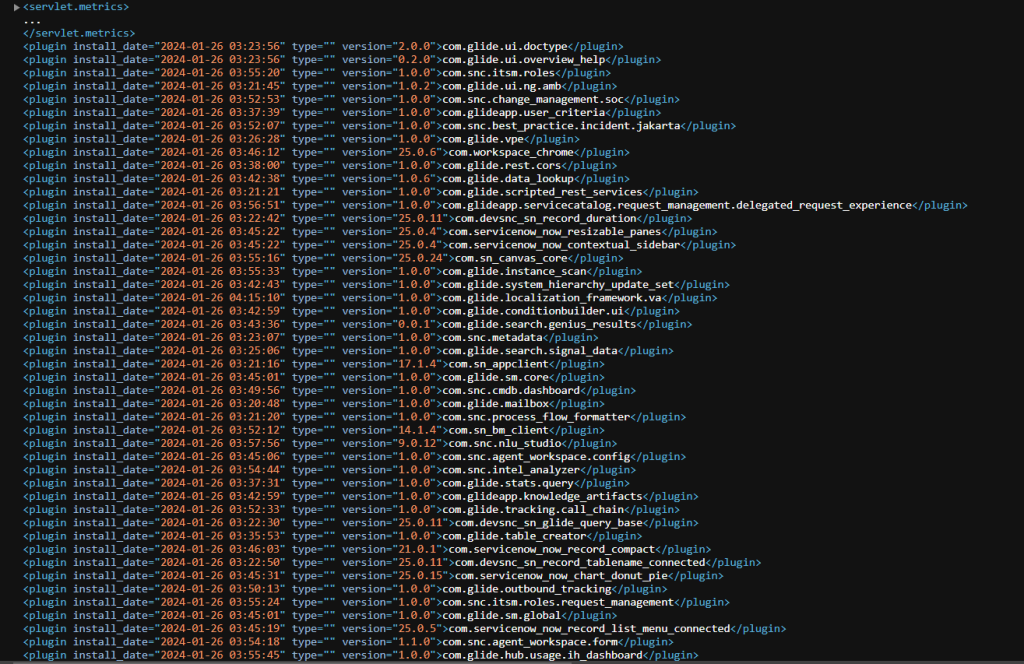
Plugin Details:
This section lists all the plugins installed in the instance, their versions, and installation dates. This information helps quickly identify when specific plugins were installed in the instance.
In addition to the above metrics, other important information like instance data replication details, event details, mid servers in the instance details, uri response times, jvm details and memory details in the instance can be found from the xmlStats.do command. This information provides comprehensive view of the instance performance health.
The “Include” Argument:
Use the xmlStats.do?include=<section> command to pull up specific section details. Instead of pulling up the whole xml output of the ServiceNow instance performance, this argument can be used to specific piece of information the admins need.
For example, to only get thread details, use xmlStats.do?include=threads. This helps to get more understandable pieces of information from a complex xml output.
Helpful docs:
- https://docs.servicenow.com/bundle/washingtondc-it-operations-management/page/product/event-management/task/xmlstats-oi-self-health.html
- https://docs.servicenow.com/bundle/xanadu-it-operations-management/page/product/event-management/task/monitor-event-processing-metrics.html
- https://docs.servicenow.com/bundle/xanadu-servicenow-platform/page/administer/instance-data-replication/reference/IDR-XML-stats.html


