Debugging is part of every developer’s journey. It’s like a treasure hunt, except the treasure is fixing bugs and the map is full of twists and turns. It is an art that needs logic, patience, and the right tools. If you’ve ever spent hours trying to untangle a script only to realize you missed a semicolon, you’re not alone. Enter the ServiceNow Script Debugger, a powerful yet often under-utilized tool that transforms the debugging experience.
But what makes the Script Debugger such a game-changer? It’s not just about stopping the code at certain points; it’s about giving you full visibility into the flow of your script, helping you spot issues instantly without guesswork. Whether it’s checking variable values in real time, stepping through code line-by-line, or evaluating complex objects during runtime, the Script Debugger streamlines your entire debugging process, making it invaluable for ServiceNow development services.
In this article, we have broken down the Script Debugger’s features, showing exactly how to use it, that will make troubleshooting faster and smarter.
Features of Script Debugger
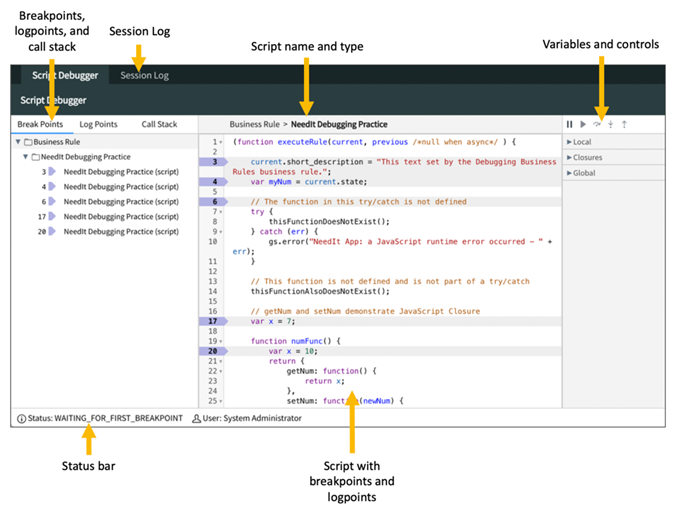
- Breakpoints for Precision:
- Pause the script execution at critical lines to analyse the logic step-by-step.
- Quickly identify faulty conditions or unexpected behaviour.
- Step Actions for Complete Control:
- Use Step Over to move to the next line, Step Into to dive deeper into function calls, and Step Out to exit back to the calling code.
- Perfect for following the script flow without getting lost in complex logic.
- Live Variable Inspection:
- No need for excessive logging—hover over variables or use the inspector to view their real-time values.
- Ideal for identifying incorrect assignments or unexpected data.
- Evaluate Console for On-the-Fly Testing:
- Execute JavaScript snippets or inspect objects during runtime without modifying your script.
- Great for testing conditions or exploring object properties dynamically.
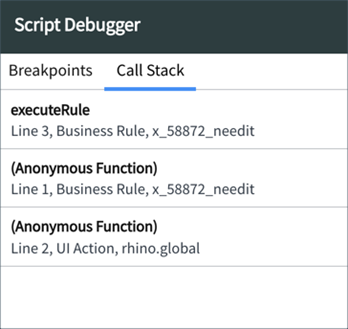
- Call Stack for Context:
- Trace the sequence of function calls to see how you arrived at the current breakpoint.
- Pinpoint the source of an issue when multiple functions are involved.
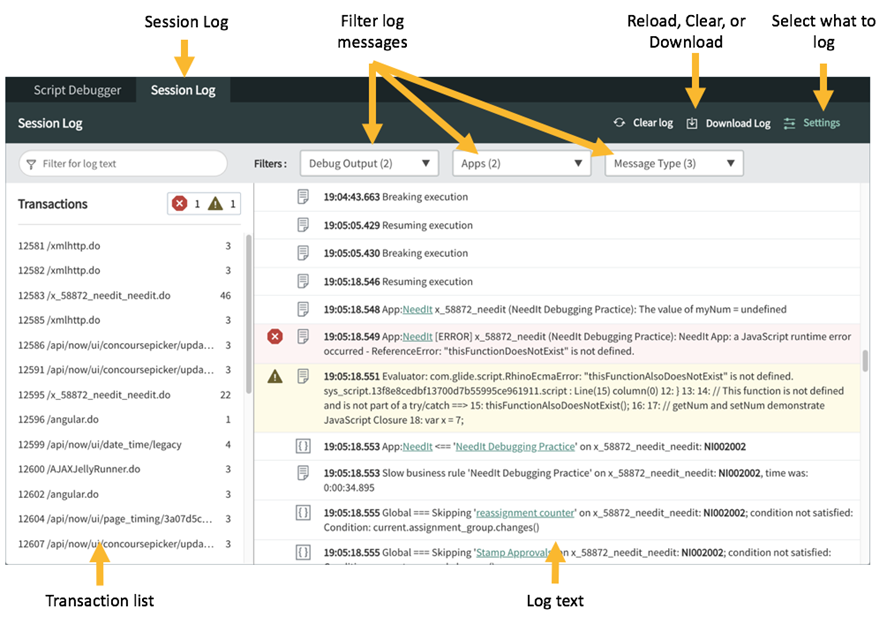
- Integrated Debug Logs:
- View structured logs to track script execution and errors in real time.
- Filter and search through logs to focus on relevant details.
Practical Example: Debugging a Script Include
You’re troubleshooting a Script Include that should update the Short Description field of an Incident when a Related Change Request is updated.
Steps:
- Open the Script Include
Navigate to Script Includes and open the relevant script. - Set a Breakpoint
- Right click in the gutter next to the line where you want to pause execution.

- Breakpoints are indicated by a purple arrow and a gray background on the breakpoint line. Conditional breakpoints are indicated by yellow arrow.

- Open the Script Debugger
Click the Script Debugger icon to open the debugger window.- Script Debugger Icon: This icon open an active script debugger window.

- Script Debugger Window: This window opens up with the script from where it was opened.

- Trigger the Script Include
Update or complete the related Change Request to trigger the Script Include. - Step Through the Script
- Use navigation controls to step through the script.

- From left to right, we have five controls to move through the script.
- Pause: Stops the session and disables the debugger.
- Resume: Continues execution to the next breakpoint or script end.
- Step Over: Executes a function without stepping into its code.
- Step Into: Steps into a function to debug its internal code.
- Step Out: Exits the current function and returns to the calling script.
- Inspect Variables
Hover over variables like current.short_description to check their values. - Use the Console
- Use the Console to evaluate expressions or check other variables.

- Check the Call Stack/ Transaction details
- View the Call Stack to see list of methods and functions called to run as part of the script execution.

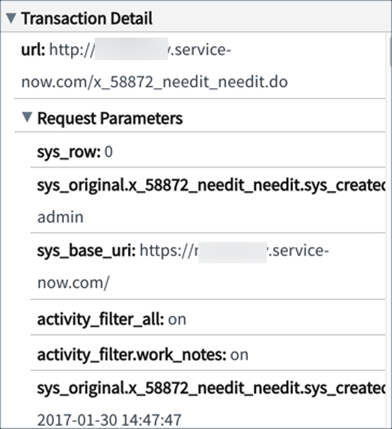
- View the Transaction Details to know about the current transaction including the URL, session ID, user, request parameters, instance, start time, and more.

- Resume or Step Out
Click Resume or Step Out to continue or finish debugging. - Review Debug Logs
- Check debug logs for additional details and confirm the issue.

Limitations of the Script Debugger
While powerful, the Script Debugger has its limitations:
- Server-Side Only: It doesn’t support client-side debugging. For that, use browser dev tools.
- Performance Impact: Debugging live might slow down instance performance slightly.
Conclusion: Debug Smarter, Not Harder
The ServiceNow Script Debugger is an essential part of any ServiceNow consulting or ServiceNow Managed Services toolkit. With features like breakpoints, variable inspection, and real-time evaluation, it simplifies debugging, empowering you to resolve complex issues with precision.
So, the next time you’re stuck in a debugging loop, remember: the Script Debugger isn’t just a tool; it’s your path to clarity and control. Try it out and let us know your favourite features!
Read More:


