Understanding the Debugging Java Applications Mindset
The world of Java development is thrilling. But, most of all, bugs in your code will make even the most veteran developers feel as though debugging—that is, pointing out and fixing those bugs—is always a huge task. However, with the right approach and a toolbox of techniques, debugging Java applications can be effectively turned into a troubleshooting exercise. In this blog, we talk about valuable tips and tricks to streamline the process of debugging Java applications.
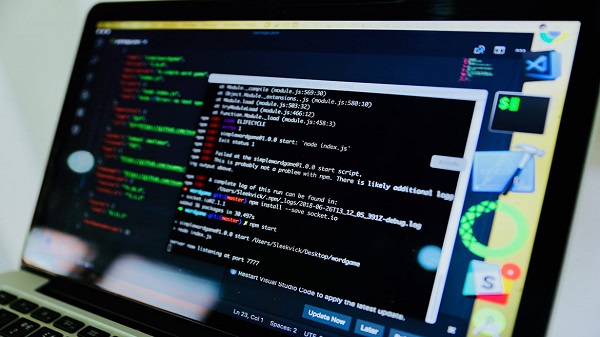
Image: Davidxiang
Before we get into specifics on how to do it, there is an attitude that you need to cultivate to do effective debugging Java apps – a switch from frustration to problem-solving. Think of bugs as challenges rather than obstacles in your way. This sets off a more organized and fruitful experience in debugging.
Reproducing the Problem
The foundation of efficient debugging is consistently reproducing the issue.
- Identify Symptoms: Clearly define the unexpected behavior you are currently encountering (e.g., error messages, incorrect outputs).
- Isolate the Problem: Try reducing your code to a minimum that still produces the bug. Can you isolate the problem in a short, self-contained, and self-explanatory code snippet that clearly shows the problem?
- Control the Environment: Note down any specific conditions or inputs necessary to reproduce the issue.
Leveraging Debuggers
Debuggers are strong utilities that allow stepping through the code by examining line-by-line, viewing and controlling the variable outputs, and controlling the program execution. Most IDEs (Integrated Development Environments) come bundled with an inbuilt debugger. Examples of the functionalities of these debuggers include:
- Setting Breakpoints: This means stopping the running of the program at some given lines of code.
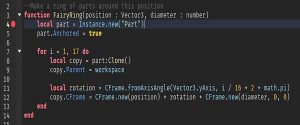
- Stepping Through the Code: executes the code statement after the statement to look at the variable values.
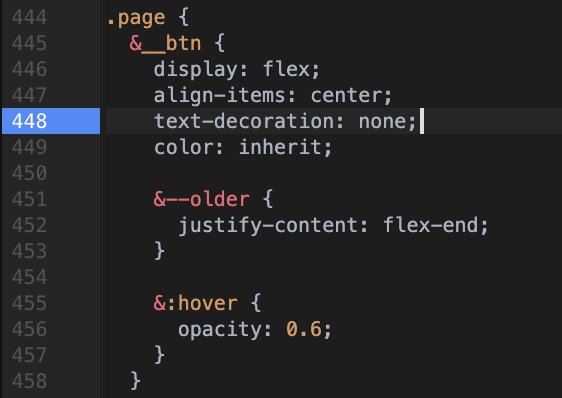
- Inspecting Variables: View the values of variables at any point during execution.
- Using Debuggers Integrated into IDEs: Any popular IDE, for example, IntelliJ IDEA or Eclipse, provides a good debugger right in its package with a comfortable, intuitive interface.
Mastering Breakpoints
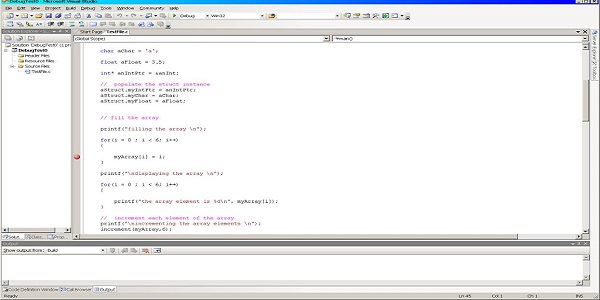
Breakpoints are your allies in the debugging battleground. Here’s how to use them strategically:
- Strategic Breakpoints: Points where the major points in the flow of code execution, like function call returns, or immediately before entering a suspicious code section.
- Conditional Breakpoints: Takes breakpoint use to the next level. Make a breakpoint but with a condition statement on when it should be triggered (i.e. when a certain variable is at a certain value).
Utilizing Print Statements (Cautiously)
Sometimes, a simple System.out.println() statement can be a debugging lifesaver. Use print statements judiciously, removing them once the bug is identified. Here’s how to use them effectively:
- Check the Variable Values: this can be done by inserting temporary print statements that print the values of the variables at certain points in your code. This will help you trace changes and notice where there might be surprising values.
- Code clutter: Excessive print statements can clutter your code, making it harder to read and maintain.
- Performance impact: Frequent printing can introduce slight performance overhead, especially in tight loops.
Decoding Stack Traces
Java will throw an exception with a stack trace. This is a descriptive message of the succession of method calls that led to this error. Meaning, you would need to interpret this as:
- Reading the Stack Trace: This is through reading of the stack trace whereby it lists methods and calls in backward chronological order, and the bottom line points to the line of code that caused the exception.
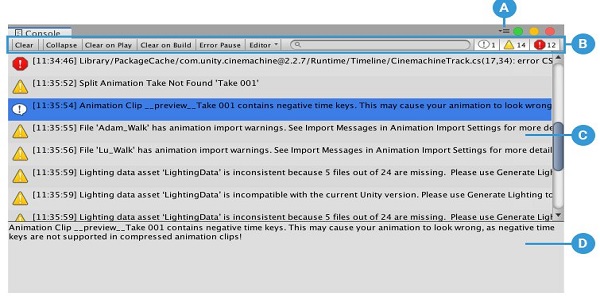
- Identifying the Source: Identify the one line at the bottom of the stack trace. That is the line where the exception came from.
Stack traces provide valuable clues about the root cause of exceptions. Learn to read and interpret them effectively.
Advanced Debugging Techniques
As your debugging skills evolve, explore these advanced techniques:
- Watchpoint: Enable tracking the change of given variables in the course of code execution and therefore help get a picture of the way values are changing.
- Remote Debugging: The debug applications run on the server without changing the deployment environment. This is very useful in doing production debugging.
Profiling Tools for Performance Issues
But the debugging does not end in the correction of errors; instead, it goes all the way up to optimization. The profiler tool is software that looks for bottlenecks in your code that are causing reduced performance.
- Identifying Bottlenecks: Such tools can expose which part of the code consumes too many resources (CPU time, memory).
- Optimizing Code Execution: Make use of profiling data to optimize areas of the code for better operation.
Unit Testing for Preventive Debugging
Don’t wait for bugs to manifest in your application – catch them early in the development process with unit testing.
- Writing Unit Tests: These are small, focused tests created to ascertain the functionality of individual units of code (e.g. functions, classes) among others.
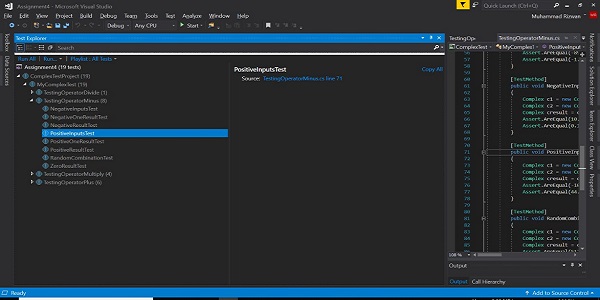
- Isolating Failing Code Sections: When a unit test fails, it pinpoints the specific code section with the issue, saving you time during debugging.
Unit testing does provide a preventive debugging approach, as it minimizes the effort that is to be put in later for comprehensive debugging during development.
Leveraging Logging Frameworks
A few print statements might come in handy for some quick debugging, but more professionally and considerate of the production environment, you should think about using logging frameworks.
- Structured Logging: Logging frameworks like Log4j or SLF4j offer structured logging capabilities. This allows you to log messages with specific levels (e.g., debug, info, error) and additional context (e.g., timestamps, thread IDs).
- Centralized Configuration: Centralized Configuration systems offer centralized configuration for logging behavior that allows you to control the level of detail that’s logged and where the logs are stored.
- Advanced Features: Most of the logging tools do provide many advanced features with a variety that include file-based log rotation, filtering, and integration with monitoring tools.
Debugging Asynchronous Code
Modern Java applications often use asynchronous coding techniques with callbacks and futures. The following are some considerations for putting in place during debugging of asynchronous code:
- Understanding Asynchronous Flow: Understanding how the asynchronous execution flow works with Java. Also, understanding the structure of the invoked callback carrying the completion or error signal in the future.
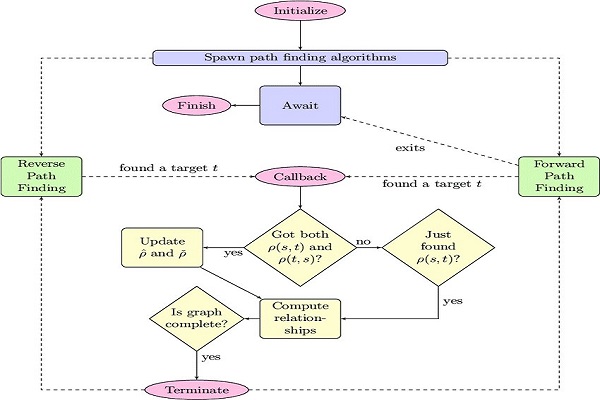
- Debugging Tools: Some debuggers come with tools meant for the asynchronous code only. In this case, such tools would enable one to actually see the flow of execution of asynchronous tasks and thus help in solving some issues.
- Asynchronous Logging: Log important information in the asynchronous operations using logging frameworks to follow the execution or problem finding.
Debugging Best Practices
- Code Readability and Maintainability: Maintain your code clean, with well-described details through comments. It helps with maintainability, and also, debugging will be faster, since with a clear structure and meaningful usage of the names of your variables, it’s easier for others to understand your code’s structure and logic.
- Importance of Clear Comments and Documentation: Add comments to clear up complex logic and non-obvious code sections. If a person different from you will work with your code in the future, then the comments will only benefit him or her if, for some reason, the return to the written is necessary. Make your documentation clear and consider adding some elements, like references to your API or design decisions for your application.
This documentation also provides a background to such programs and provides an understanding of how the different parts of the code relate to each other, therefore aiding the process of debugging. Following these best practices for debugging will help you write code that is not just functional, but also easily traceable in times of adversity.
Comparison of Debugging Techniques
| Technique | Description | Advantages | Disadvantages |
| Breakpoints | Pause execution at specific code lines | Allows for controlled step-by-step debugging | Can interrupt program flow if not strategically placed |
| Print Statements | Log variable values at specific points | Simple to implement, helpful for quick checks | Can clutter code and impact performance if excessive |
| Stack Traces | Detailed messages indicating the source of exceptions | Provides valuable clues about the root cause of errors | Can be overwhelming for beginners |
| Watches | Monitor specific variables during execution | Offers real-time insights into variable changes | Requires additional setup and focus |
| Unit Testing | Write small, focused tests for individual code units | Promotes preventive debugging, catches bugs early | Requires additional time investment upfront |
| Profiling Tools | Analyze application performance and identify bottlenecks | Helps optimize code execution and improve application responsiveness | May require specific profiling tools and interpretation skills |
| Remote Debugging | Troubleshoot applications running on servers | Enables debugging without modifying deployment environments | Requires additional configuration and network access |
The table summarizes important debugging techniques, pointing out their strengths and weaknesses so that your choice is guided by a particular debugging scenario. Effective debugging, on the other hand, is a balance between quite a few good tools and a methodical approach, plus a steady state of mind. Learn these techniques and cultivate an attitude toward problem-solving because it turns debugging from drudgery into a useful skill that allows you to write robust and effective Java applications.
Case Study-1: NullPointerException
Assuming that there is a method trying to take the name property from an object reference (user), but the method is mistakenly null. This would cause a NullPointerException.
Debugging Steps
- Reproduce the Issue: Write a simple test case that triggers the NullPointerException.
- Set a Breakpoint: Place a breakpoint at the line where the null pointer exception occurs.
- Check Variables: Use the debugger to check the value of the user variable just before the line that was giving a problem. If it is null, then you have the root of the problem.
- Fix the Code: Ensure the user is properly initialized with a valid object reference before accessing its properties.
Case Study-2: Infinite Loop
It means that an infinite loop can hang in your application, for example, a loop iterating over a list of items without a proper termination condition.
Debugging Steps
- Identify Symptoms: The application might become unresponsive, indicating a potential infinite loop.
- Print Statements (cautiously): Inside the loop, insert a temporary System.out.println() statement that prints the value of a loop counter variable. That will help to confirm whether the loop is stuck.
- Set a Breakpoint: Place a breakpoint inside the loop to pause execution and examine the loop counter’s value.
- Fix the Code: Correct the code to end the loop at some point; for example, you may use it to check whether the count is not greater than the size of the list.
These case studies demonstrate how to combine various debugging techniques to tackle common Java application issues.
Conclusion
Mastering these tips and getting better with your debugging will set you on the right track to create robust, high-performing custom Java application development solutions. With larger and more complex issues that come across your desk, you’ll be constantly honing your skills and be an expert troubleshooter even for the most devious Java application bugs. In an organized and productive frame of mind, you will be prepared to approach debugging with the right set of tools and techniques in place.
Frequently Asked Questions (FAQs)
Understanding these common questions and answers should make you better prepared to handle different debugging cases. Here are some frequently asked debugging questions:
1) When should I use a debugger?
Use the debugger anytime you’re going to have to step through code, line-by-line, look at variables, or control execution flow. This will help with complex logic, or if the print statements themselves just aren’t cutting it.
2) How do I debug multithreaded applications?
This would make debugging the threaded applications even more complex. Most debuggers come equipped with the provision of thread control (like suspension and resumption). Use it and thoroughly traverse the state of each thread during debugging.
3) What are some good debugging practices?
Keep variable names clean and descriptive; don’t pollute your code with junky variable names. Avoid, if possible, creating complex logic structures and lines of code that go on forever. A linter or a code formatter can be used to enforce coding standards and improve readability.


