Introduction: ServiceNow Instance Performance Optimization
A well-performing ServiceNow example is fundamental for guaranteeing smooth IT tasks and conveying a consistent client or use experience within an organization. However, as user instances during ServiceNow solutions grow in complexity and size, performance difficulties can arise, possibly affecting efficiency and user satisfaction. Identifying and addressing these challenges promptly is key to optimizing ServiceNow instance performance and efficient environment.
Some common signs of performance issues include:
- High loading times for lists, reports, and dashboards.
- The instance taking longer to respond during user interactions with the UI.
- Flows and email sending experiencing delays, slowing down critical processes.
READ – Unlocking Platform Troubleshooting in ServiceNow: Deep Dive into the xmlStats.do Command
Following are the effective measures that can be followed for an efficient system ServiceNow instance performance:
1) Monitor Long-Running Transactions
To monitor active transactions:
– Navigate to Active Transactions (All Nodes) under the System Diagnostics module using the Filter Navigator.
– URL: instance.com/now/v_cluster_transaction_list.do
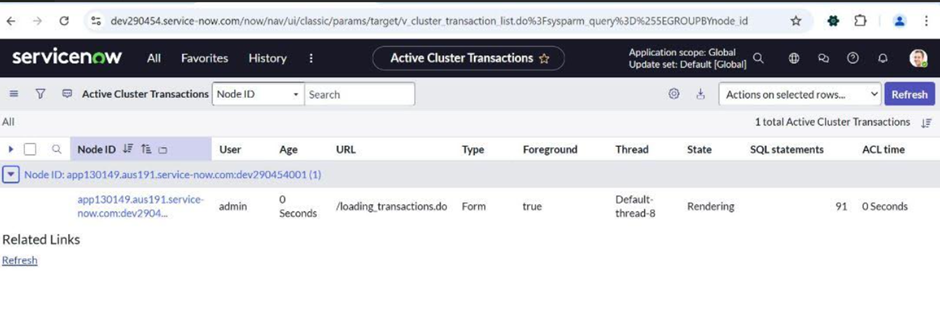
This provides a node-wise view of active cluster transactions. If a transaction is running longer than expected, it should be analyzed and optimized. For instance, scheduled jobs that run for extended periods can consume node memory, impacting system performance. (Typically, ServiceNow platform for ITSM creates an automated case when semaphore exhaustion occurs).
2) Scheduled Jobs and Their Impact
Scheduled jobs can often cause issues in ServiceNow instance performance. Their performance can be reviewed under related modules under the System Diagnostics section of the Filter Navigator.
– Running and pending scheduled jobs are listed here, along with node-wise details to assess node health.
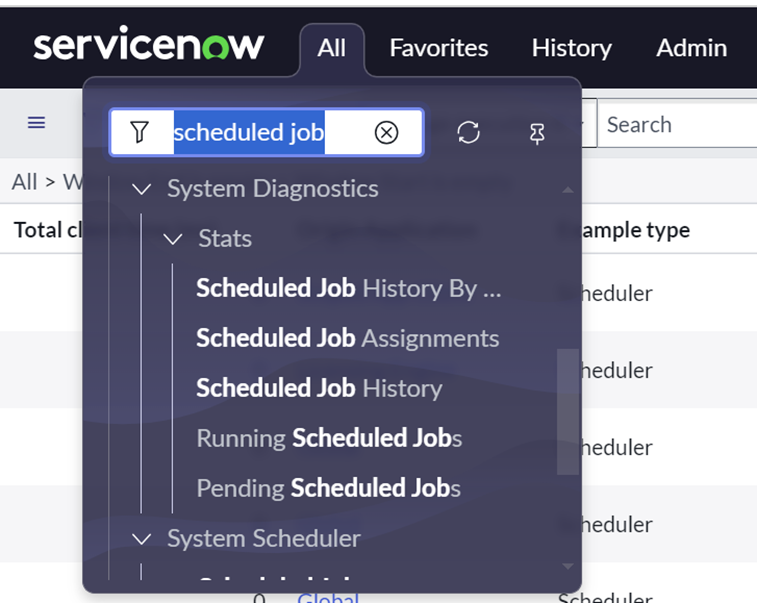
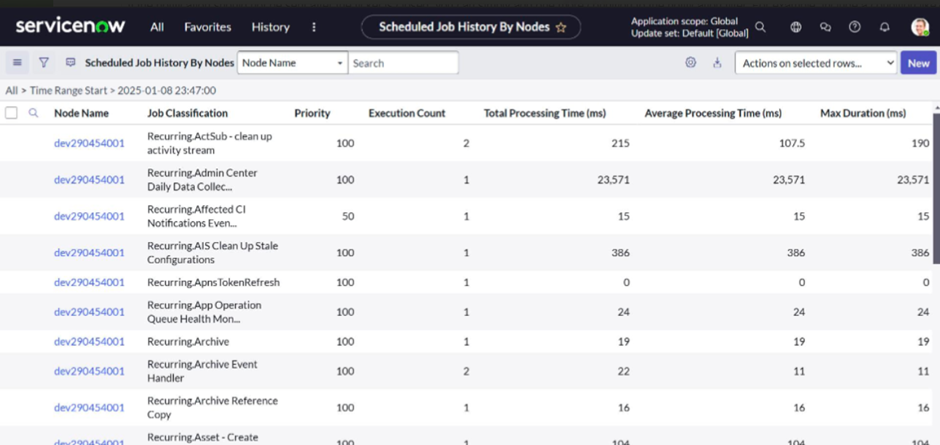
– Best practices include avoiding overlapping long-running scheduled jobs and scheduling them during non-peak business hours. This significantly enhances ServiceNow instance performance.
READ – Comparing Salesforce and ServiceNow: Choosing the Right Platform for Your Business
3) Review System Events
Another key area to monitor is System Events in the instance. ServiceNow Implementation often creates an automated case, (with the description: System Event Queue Impact – Delay in Processing , when event-related performance issues arise.
– Navigate to the System Events and Scheduled Job Monitoring Dashboard under the System Diagnostics module via the Filter Navigator.
– URL: `instance.com/now/event_jobs/dashboard/params/queue`
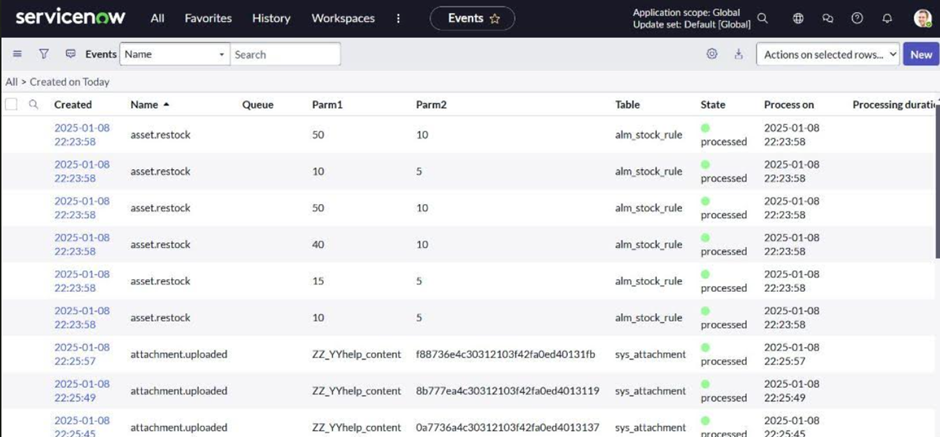
This dashboard offers an overview of event processing in the instance.
– If the total ready events exceed 1 million, analyze and optimize the event types to ensure smoother processing. Abnormal event count can cause flow processing issues and other ServiceNow Managed Services integrations degradation in the system.
4) Check Node Health
Node health can be evaluated by accessing the sys_cluster_state table:
1. Use the Filter Navigator to locate the table.
2. Click on the Node Stats column for detailed node health analysis.

The stats provide critical information such as:
– Number of jobs running on the node
– Memory utilization and memory pressure
– JVM data
For further reference, visit: Reduce unnecessary events.
READ – How ServiceNow’s AI & Computerization are Changing Businesses
5) Review Slow Queries and Slow Transactions
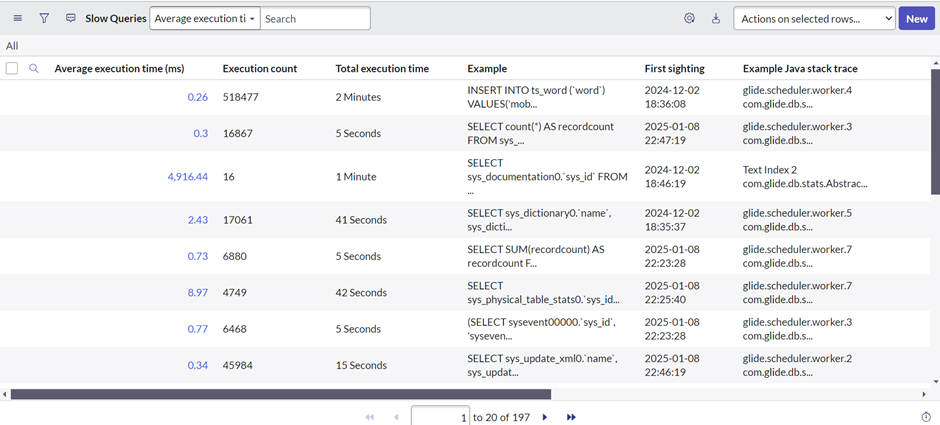
Under the System Diagnostics module, you can analyze Slow Queries and Slow Transactions.
- Slow Queries: Provides details on database queries taking longer than expected. These queries can be from any Business Rule, any Script include or any Scheduled Job. The slow query generating script can be found from Example URL or Example Java stack trace.
- Slow Transactions: along with Active Transactions (All Nodes), This module can also be used to find the transactions causing delays in system performance.
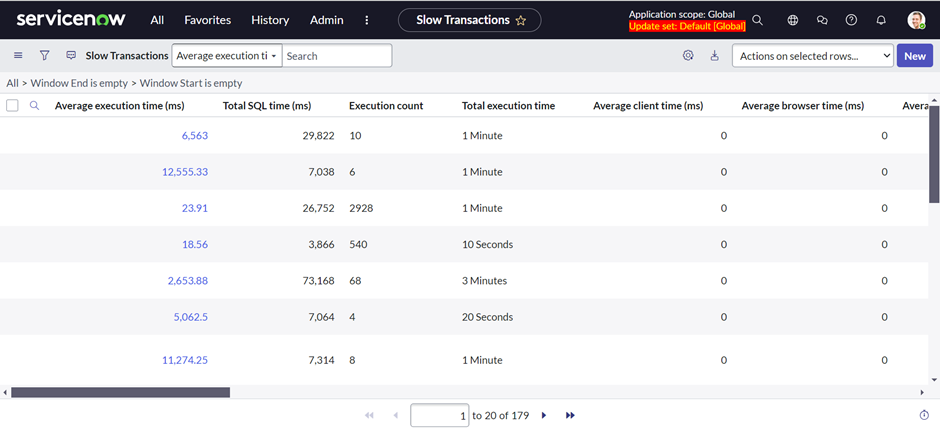
Analyzing these helps identify bottlenecks in data retrieval and transaction processing. Average Client side time, Server side Time and SQL time can be found from this table providing insights to identify which process taking longer time. This process uncovers the root causes of underlying performance issues.
By following the steps above, you can effectively identify and address challenges, ensuring a smoother and more reliable ServiceNow instance performance. Moreover, with ServiceNow support services, you can have expert assistance and guidance in upgrading designs, troubleshooting complex issues, and streamlining the customer workflows at its maximum potential.


